Fichier:3 examples of internal climate variability (1950-2012), the El Niño – Southern Oscillation, the Arctic Oscillation, and the North Atlantic Oscillation (NOAA).png

Le contenu de la page n’est pas pris en charge dans d’autres langues.
Une page de Wikipédia, l'encyclopédie libre.

Ce fichier et sa description proviennent de Wikimedia Commons.

Cette image (de type diagramme) devrait être recréée dans un format vectoriel, en tant que fichier SVG. Cela offrirait plusieurs avantages : voir Commons:Media for cleanup pour plus d'informations. Si une version SVG de cette image est déjà disponible, merci de bien vouloir l'envoyer. Après cela, remplacez ce modèle par {{vector version available|nouveau nom d'image.svg}}.

Description

Description
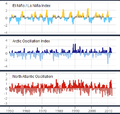
English: This image shows three examples of internal climate variability between 1950 and 2012: the El Niño–Southern oscillation, the Arctic oscillation, and the North Atlantic oscillation (see the Intergovernmental Panel on Climate Change (IPCC, 2001) for a definition of "internal" climate variability). The El Niño – Southern Oscillation (ENSO) is a recurring climate pattern involving changes in the temperature of waters in the central and eastern tropical Pacific Ocean (NOAA Climate Program Office, 2009a). The Arctic Oscillation (AO) refers to an atmospheric circulation pattern over the mid-to-high latitudes of the Northern Hemisphere (NOAA Climate Program Office, 2009b). The North Atlantic Oscillation (or NAO) is a prominent pattern of climate variability that has a strong influence on weather over north-eastern North America, Greenland, and Europe (NOAA Climate Program Office, 2009c). The top graph shows the ENSO, the middle graph the AO, and the bottom graph the NAO.

In the top graph, the ENSO cycle is measured using the Oceanic Niño Index or ONI (for details, see NOAA Climate Program Office, 2009a). In the middle graph, the AO is measured using the Arctic Oscillation Index (for details, see NOAA Climate Program Office, 2009b). In the bottom graph, the NAO is measured using the North Atlantic Oscillation Index (for details, see NOAA Climate Program Office, 2009c).

References: IPCC, 2001: Appendix I - Glossary: Climate variability, in: Climate Change 2001: The Scientific Basis. Contribution of Working Group I to the IPCC Third Assessment Report (J.T. Houghton, et al., (eds)). Cambridge University Press; NOAA Climate Program Office, August 30, 2009a: ClimateWatch Magazine » Climate Variability: Oceanic Niño Index. NOAA; NOAA Climate Program Office, August 30, 2009b: ClimateWatch Magazine » Climate Variability: Arctic Oscillation. NOAA; NOAA Climate Program Office, August 30, 2009c: ClimateWatch Magazine » Climate Variability: North Atlantic Oscillation. NOAA.
Date
Source NOAA Climate Services: Climate Variability (Flash object), publisher: NOAA
Auteur NOAA
Autorisation
(Réutilisation de ce fichier)
Privacy Policy, Disclaimer, and Copyright Notice: ngdc.noaa.gov: "As required by 17 U.S.C. 403, third parties producing copyrighted works consisting predominantly of the material produced by U.S. government agencies must provide notice with such work(s) identifying the U.S. Government material incorporated and stating that such material is not subject to copyright protection within the United States. The information on government web pages is in the public domain and not subject to copyright protection within the United States unless specifically annotated otherwise (copyright may be held elsewhere). Foreign copyrights may apply."

Conditions d’utilisation

Public domain
Cette image est dans le domaine public car son contenu provient de la
National Oceanic and Atmospheric Administration
, réalisé par un employé dans le cadre de ses activités professionnelles.

العربية  čeština  Deutsch  Zazaki  English  español  eesti  suomi  français  hrvatski  magyar  italiano  日本語  한국어  македонски  മലയാളം  Plattdüütsch  Nederlands  polski  português  română  русский  sicilianu  slovenščina  Türkçe  Tiếng Việt  简体中文  繁體中文  +/−

Légendes

Ajoutez en une ligne la description de ce que représente ce fichier

Éléments décrits dans ce fichier

dépeint

image/png

bad895dfaef9279cd544e805661fd66f1336f772

14 943 octet

374 pixel

393 pixel

Historique du fichier

Cliquer sur une date et heure pour voir le fichier tel qu'il était à ce moment-là.

Date et heureVignetteDimensionsUtilisateurCommentaire
actuel22 août 2012 à 01:03Vignette pour la version du 22 août 2012 à 01:03393 × 374 (15 kio)Enescot{{Information |Description ={{en|1=This image shows three examples of internal climate variability between 1950 and 2012: the El Niño – Southern Oscillation, the [[:en:Arctic Oscillation|Arctic Oscillatio...

La page suivante utilise ce fichier :

Usage global du fichier

Les autres wikis suivants utilisent ce fichier :