
Fichier:1982- Deaths from mass shootings in the U.S - scatterplot and line chart.svg

Taille de cet aperçu PNG pour ce fichier SVG : 800 × 600 pixels. Autres résolutions : 320 × 240 pixels | 640 × 480 pixels | 1 024 × 768 pixels | 1 280 × 960 pixels | 2 560 × 1 920 pixels | 1 000 × 750 pixels.
Fichier d’origine (Fichier SVG, nominalement de 1 000 × 750 pixels, taille : 4 kio)
Ce fichier et sa description proviennent de Wikimedia Commons.
Description
| Description |
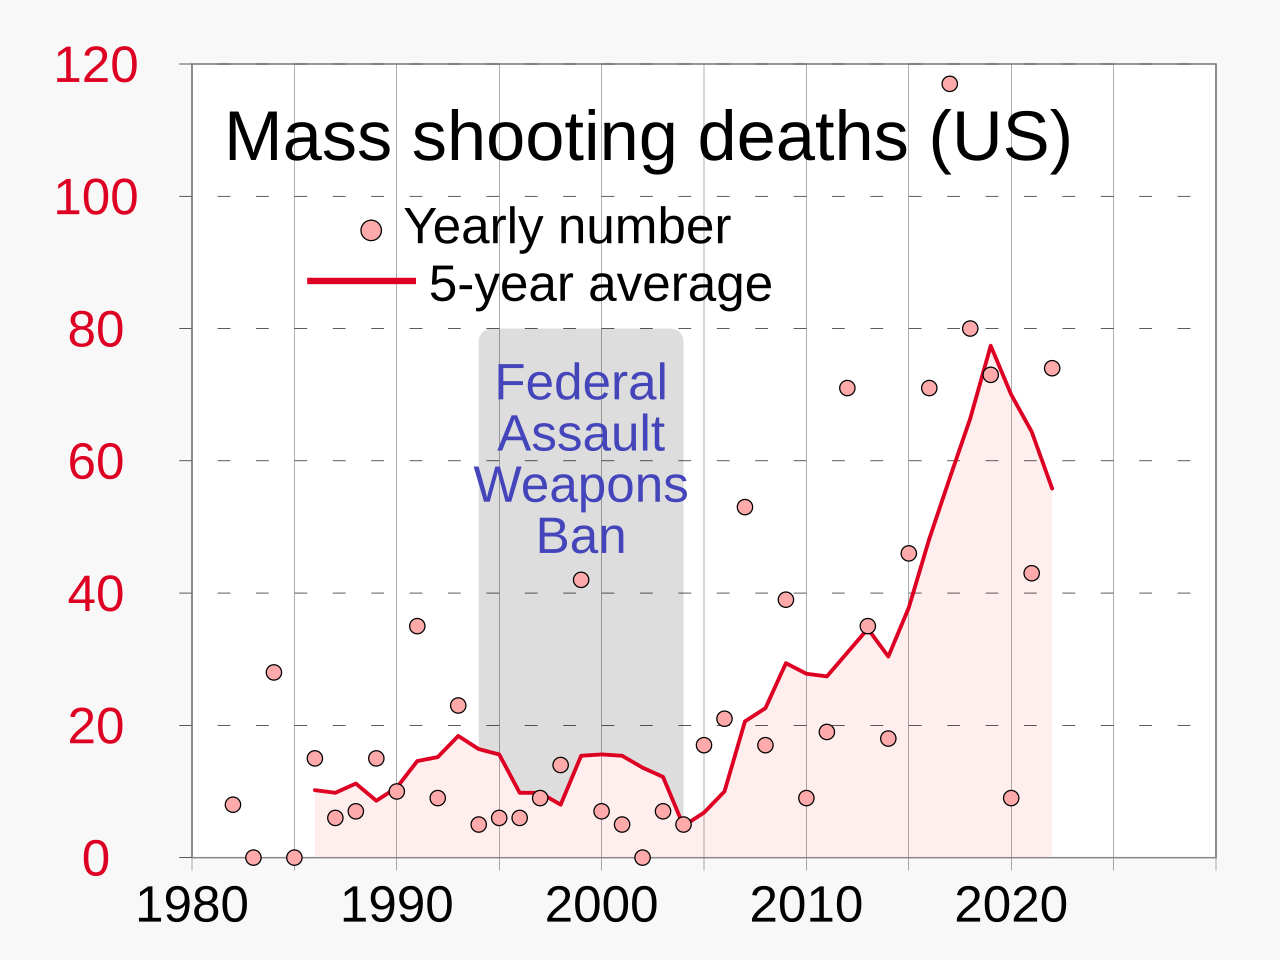
English: Chart showing deaths from mass shootings in the U.S., including 5-year moving average, beginning in 1982
|
||
| Date | |||
| Source | Travail personnel | ||
| Auteur | RCraig09 |

Related files
-
 Predecessor PNG file
 -
 Predecessor JPG file


Conditions d’utilisation
Moi, en tant que détenteur des droits d’auteur sur cette œuvre, je la publie sous la licence suivante :
Ce fichier est sous la licence Creative Commons Attribution – Partage dans les Mêmes Conditions 4.0 International.
- Vous êtes libre :
- de partager – de copier, distribuer et transmettre cette œuvre
- d’adapter – de modifier cette œuvre
- Sous les conditions suivantes :
- paternité – Vous devez donner les informations appropriées concernant l'auteur, fournir un lien vers la licence et indiquer si des modifications ont été faites. Vous pouvez faire cela par tout moyen raisonnable, mais en aucune façon suggérant que l’auteur vous soutient ou approuve l’utilisation que vous en faites.
- partage à l’identique – Si vous modifiez, transformez, ou vous basez sur cette œuvre, vous devez distribuer votre contribution sous la même licence ou une licence compatible avec celle de l’original.
Historique du fichier
Cliquer sur une date et heure pour voir le fichier tel qu'il était à ce moment-là.
| Date et heure | Vignette | Dimensions | Utilisateur | Commentaire | |
|---|---|---|---|---|---|
| actuel | 4 avril 2023 à 06:47 | | 1 000 × 750 (4 kio) | RCraig09 | Version 3: add to legend |
| 2 avril 2023 à 05:46 |  | 1 000 × 750 (4 kio) | RCraig09 | Version 2: reduce thickness of line trace to be less dominant (compatible with related charts) | |
| 31 mars 2023 à 23:43 |  | 1 000 × 750 (4 kio) | RCraig09 | Uploaded own work with UploadWizard |
Utilisation du fichier
La page suivante utilise ce fichier :
Usage global du fichier
Les autres wikis suivants utilisent ce fichier :
- Utilisation sur cy.wikipedia.org
- Utilisation sur en.wikipedia.org
- Utilisation sur en.wikiquote.org
- Utilisation sur es.wikipedia.org
- Utilisation sur he.wikipedia.org
- Utilisation sur id.wikipedia.org
- Utilisation sur it.wikipedia.org
- Utilisation sur ja.wikipedia.org
- Utilisation sur pl.wikipedia.org
- Utilisation sur pt.wikipedia.org
- Utilisation sur ru.wikipedia.org
- Utilisation sur vi.wikipedia.org
- Utilisation sur zh.wikipedia.org